CSCI 370 – Lec 17: Functional vs Non-Functional Requirements, Use Case Modeling, and UML Diagrams
🤩 Functional vs Non-Functional Requirements
Functional Requirements
Functional requirements define the specific behavior or functions of a system, essentially detailing what the system should do. These are based directly on user goals and tasks. They are concrete, measurable, and easy to verify during testing.
Key Characteristics:
- Specific to individual system functions
- Directly map to user interactions
- Expressed in the form “The system shall…”
Examples:
- “The system shall allow a user to log in with a valid email and password.”
- “The system shall generate a printable monthly report for administrators.”
- “The system shall send a confirmation email after successful registration.”
These types of requirements often correspond directly to features in the UI or system API.
Non-Functional Requirements
Non-functional requirements (NFRs) define constraints on how the system operates rather than what it does. These requirements affect the performance, usability, reliability, and maintainability of a system.
Examples:
- Performance: “System should support up to 500 concurrent users.”
- Reliability: “System uptime should be at least 99.9% per month.”
- Usability: “New users should be able to complete registration in under 5 minutes.”
- Security: “User data must be encrypted at rest and in transit.”
- Portability: “Application should run on Windows, macOS, and Linux without modification.”
Quantifying NFRs is essential for testability. Vague goals like “fast” or “user-friendly” must be made concrete.
Sample Table:
| Property | Metric Example |
|---|---|
| Speed | < 2s response time for 90% of requests |
| Size | Under 50MB installation footprint |
| Ease of Use | Max 15 min training time for basic usage |
| Reliability | Mean time between failures (MTBF) > 1000 hours |
| Robustness | System resumes within 10s of failure |
| Portability | Runs on 3 major OSs with same codebase |
🛍️ Ethnography in Software Engineering
Ethnography is a qualitative research method that involves observing real users in their working context to understand needs, habits, limitations, and environmental factors that affect software use.
Key Goals:
- Understand hidden workflows and user behavior
- Capture edge cases or tools in use outside the designed system
- Support inclusive design for varied user demographics
Examples:
- In an airport traffic control tower, software may be used by multiple people glancing at shared screens. Accessibility, font size, and multitasking are critical.
- Children using educational software may be unfamiliar with keyboard shortcuts or abstract icons, affecting UI decisions.
- Users might rely on external tools like calculators or phone apps concurrently with your software.
Design Implication:
These observations affect decisions such as:
- Screen layout
- Visual clarity
- Workflow alignment
- Help and documentation accessibility
📋 Use Case Table
Use Case Tables formally describe interactions between actors (users or systems) and the system. They help identify and validate system requirements through structured scenarios.
Use Case Components:
- Actors: Initiators or participants in the interaction
- Goal: What the actor intends to achieve
- Preconditions: What must be true before the scenario begins
- Main (Basic) Flow: Step-by-step normal scenario
- Alternative Flows: Deviations or exceptions
- Postconditions: Outcome if flow completes successfully
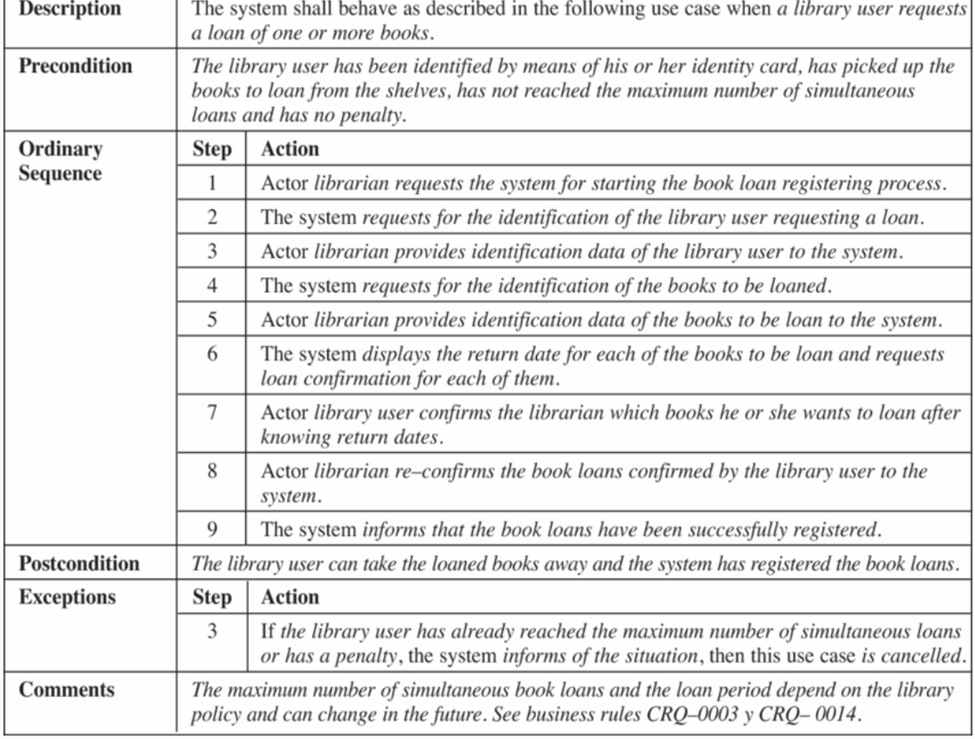
Example: Library Book Loan Use Case
Description: User borrows one or more books
Precondition: User has library card, picked up books, has no penalties, has not exceeded limit
Ordinary Sequence:
| Step | Action |
|---|---|
| 1 | Librarian starts loan registration process |
| 2 | System requests user ID |
| 3 | Librarian inputs user ID |
| 4 | System requests book IDs |
| 5 | Librarian inputs book info |
| 6 | System calculates return dates and asks for confirmation |
| 7 | User confirms selected books and dates |
| 8 | Librarian re-confirms selections |
| 9 | System registers the loans and confirms |
Postcondition: Books are registered as loaned; user can take them
Exception at Step 3: If user has reached loan limit or has penalty, system cancels request and informs librarian
Comment: Loan rules follow library policy (CRQ-0003, CRQ-0014)
🔸 Use Case Diagram
Use case diagrams summarize high-level user-system interactions visually.
Elements:
- Actors: Represented as stick figures (e.g., users, external systems)
- System Boundary: Rectangular box containing all use cases
- Use Cases: Ovals indicating actions/functions
- Relationships: Lines or arrows (solid for interactions, dashed for «include» or «extend»)
Example: Online Shopping System
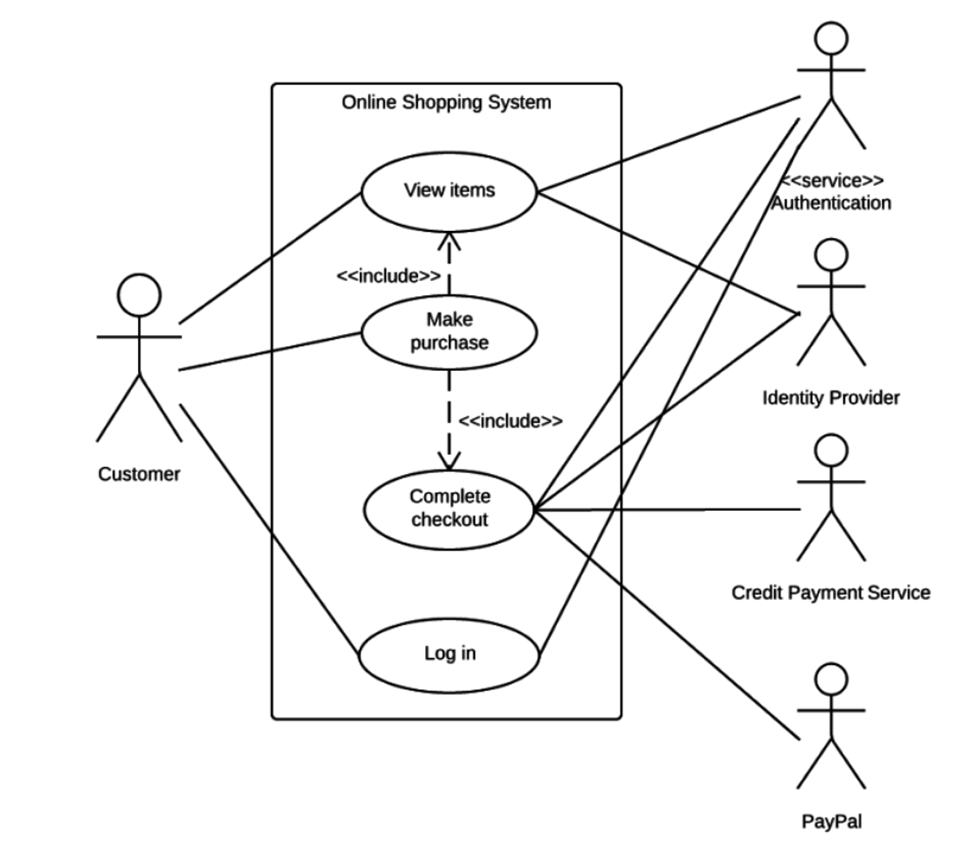
- Customer uses: View Items, Log In, Make Purchase, Complete Checkout
- System includes external authentication, credit card validation, PayPal support
- «include» is used to show reused logic like “Log In” being part of all main features
Use case diagrams are ideal for early-stage communication with stakeholders.
🔎 Context Diagram
Context diagrams offer a top-level view of a system and how it interfaces with external entities. They are often used during requirement analysis to understand data exchanges.
Components:
- System: Shown as a circle in the center
- External Entities: Rectangles surrounding the system
- Data Flows: Arrows indicating input/output of data
Example: Online Community System
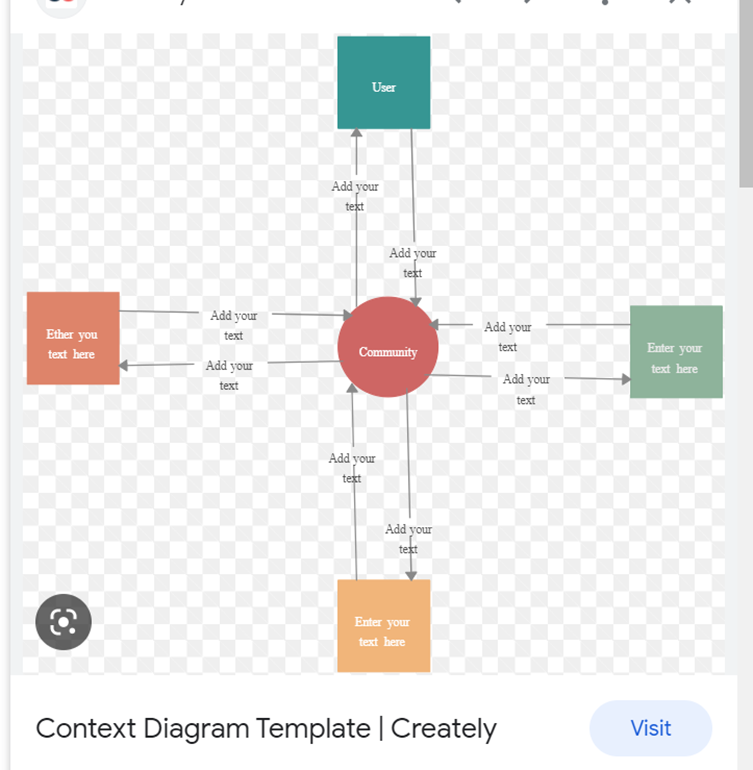
- System: Online Community
- Actors: Users, Content Creators, Advertisers, Community Manager
-
Interactions:
- Community Users: Registration, Info & Tools
- Content Creators: Provide Content → Receive Compensation
- Advertisers: Buy Ad Slots → Provide Revenue
- Manager: Views Financial Reports
This provides a single-page summary of all major data relationships.
⚖️ UML Activity Diagrams
Activity diagrams model workflows and decision points within a process. They are useful for understanding parallelism, synchronization, and conditional paths.
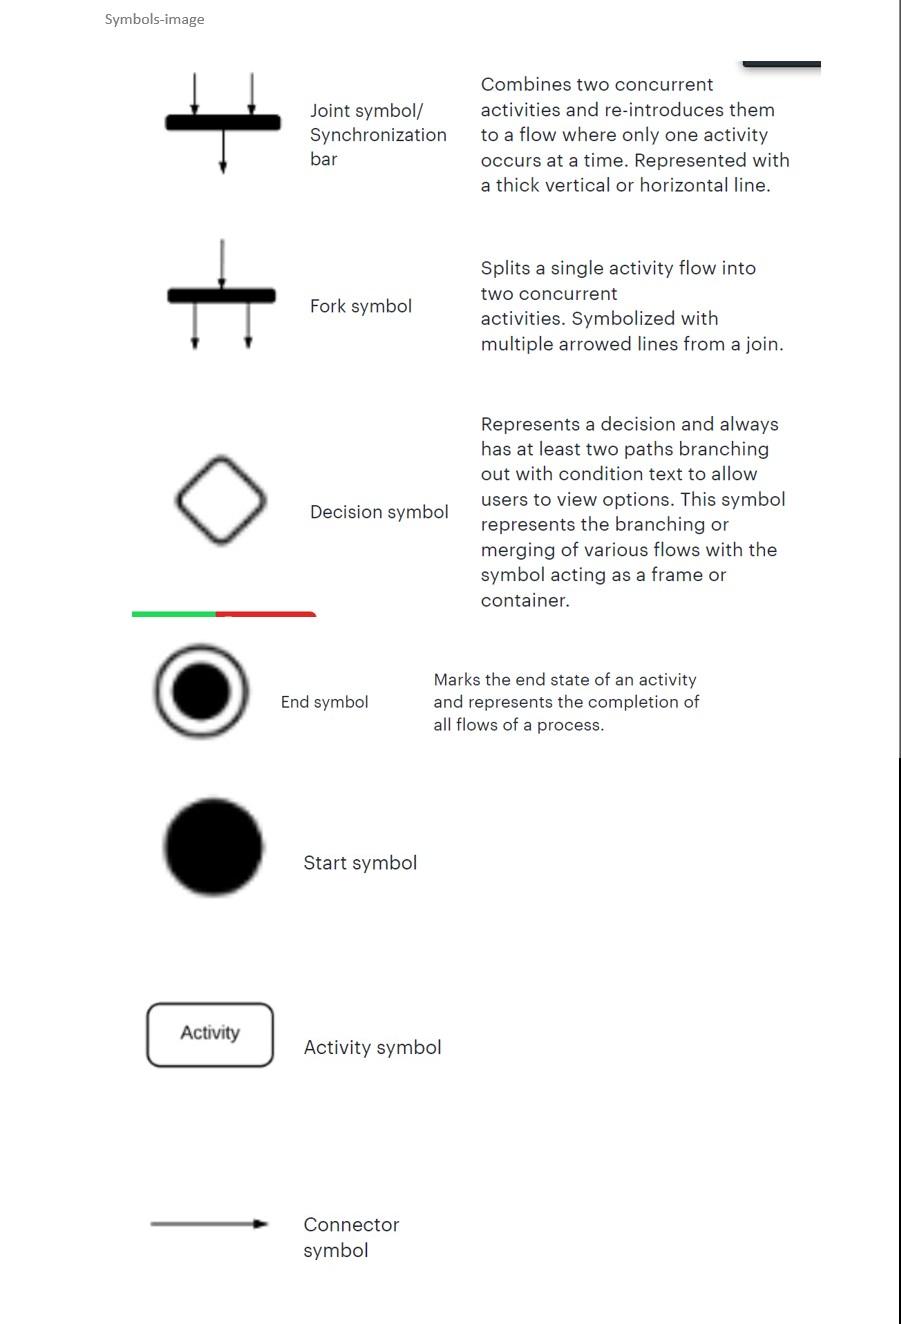
Common Symbols:
- Start Symbol: Solid black circle
- Activity: Rounded rectangle with a verb-phrase label
- Decision: Diamond with conditional branches
- Fork: One action splits into multiple parallel ones
- Join: Multiple actions synchronize to one
- End Symbol: Circle with dot inside
- Connector Arrows: Indicate control flow
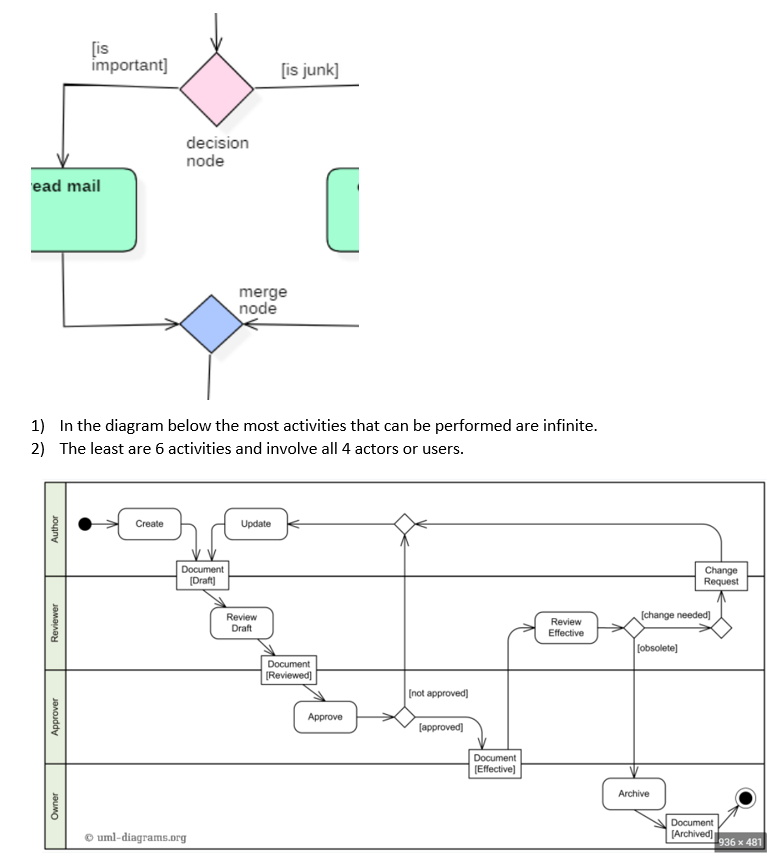
Example: Document Workflow
- Actors: Author, Reviewer, Approver, Owner
-
Flow:
- Author creates & updates
- Reviewer marks as reviewed
- Approver decides approval
- Owner archives
Minimum path involves all actors; max paths involve indefinite revision loops.
Example: Detension Admission Process
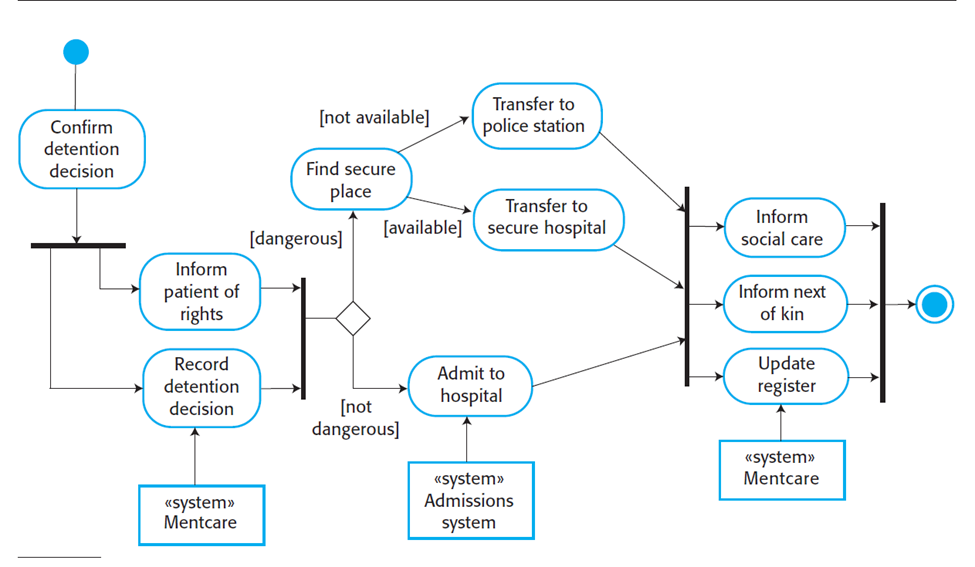
- Start: Confirm Detention
- Parallel: Record decision + Inform patient
-
Decision: Dangerous?
- If Yes: Find secure place → Police station or Secure hospital
- If No: Admit to standard hospital
- End: Notify kin, social care, update register
▶️ Sequence Diagrams
Sequence diagrams show how objects interact over time. They are useful for modeling scenarios such as user actions triggering background operations.
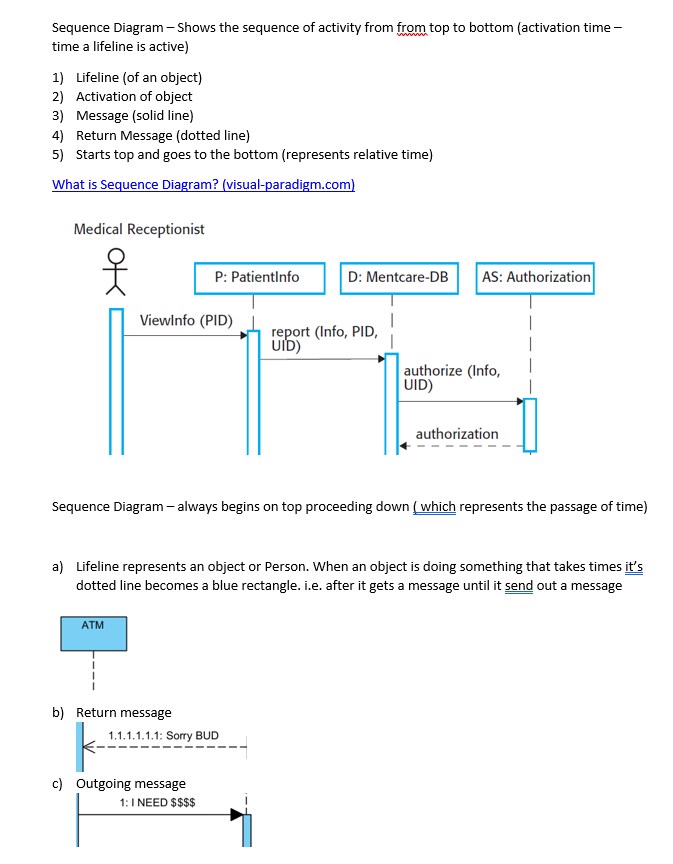
Key Elements:
- Actors and Objects: Lifelines drawn as vertical lines
- Activation: Highlighted rectangles
- Messages: Horizontal arrows for requests; dashed for returns
- Order: Time flows from top to bottom
Example:
- Medical Receptionist requests patient info
- DB replies with report
- Authorization module approves access
Another Example:
- ATM receives a request for money
- Responds with success or rejection
📊 State Diagrams
State diagrams model the lifecycle of a single object, representing its various states and transitions due to events.
Example: Car Gear System
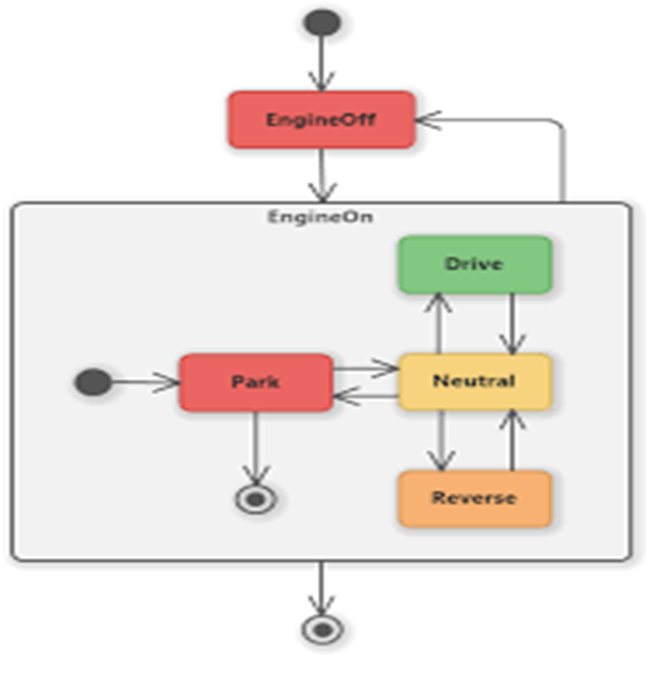
- States: EngineOff, Park, Neutral, Drive, Reverse
- Transitions: Engine toggling, gear shifting
Useful for modeling UI states, file lifecycle, or connection statuses.
Summary
This session emphasized a foundational understanding of software system modeling using:
- Functional vs Non-Functional Requirements: Understanding what the system does vs. how it performs
- Use Case Tables and Diagrams: Structuring and visualizing user-system interactions
- Context Diagrams: Mapping external system relationships
- Ethnographic Research: Designing software with real user environments in mind
- Activity Diagrams: Modeling workflows with branching and concurrency
- Sequence Diagrams: Tracing object interactions over time
- State Diagrams: Describing how a single object changes behaviorally
These tools offer a rich visual and formal framework to clarify system behavior and structure before implementation.